Therapeutic Antibodies is a category of therapeutics that plays an important role in controlling many diseases such as cancer, allergy, inflammation, infectious or autoimmune diseases. The characterization of carbohydrates structures on therapeutic proteins is of utmost importance due to their role in clearance and mechanism action.
The main techniques for carbohydrates analysis involve high-performance liquid chromatography (HPLC), mass spectrometry (MS) and capillary electrophoresis (CE). 2-aminobenzoic acid (2AB) is a dye frequently used for the analysis of mono or oligosaccharides with HPLC.
µLC-LEDIF Analysis
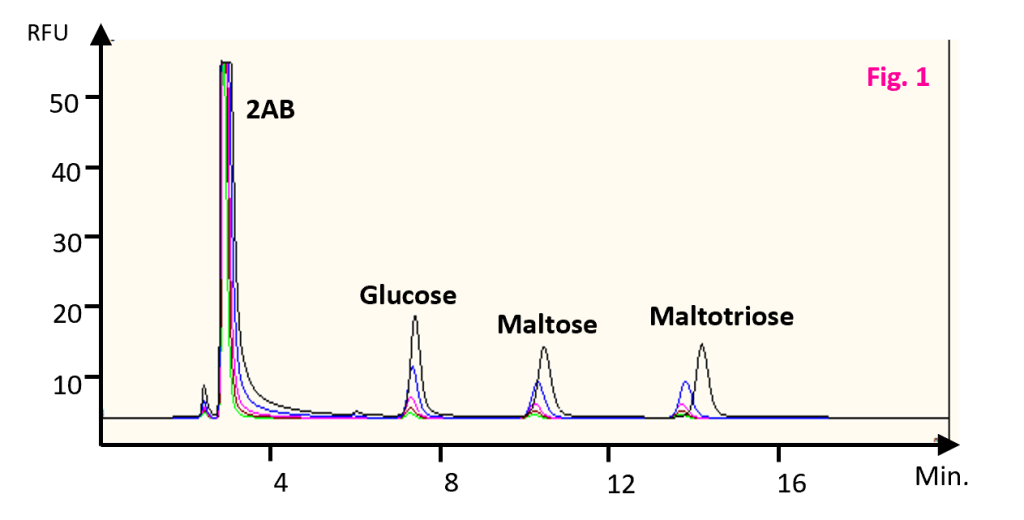
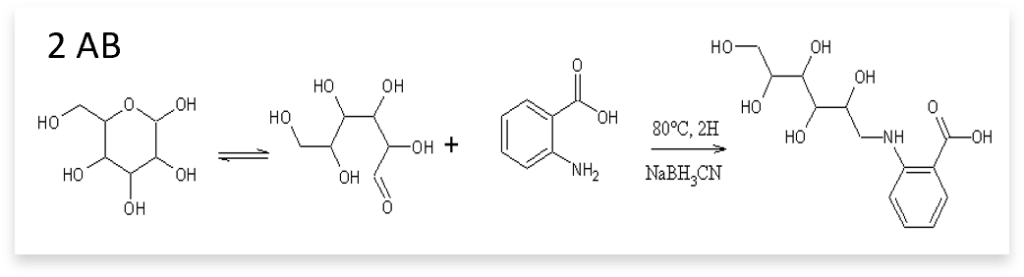
Figure 1: Analysis of Glucose, Maltose and Maltotriose labeled with 2AB by µLC/LEDIF at various concentrations:
- 50 µM (black)
- 25 µM (blue)
- 10 µM (pink)
- 5 µM (brown)
- 2.5 µM (green)
Instruments | HP1100 Agilent Technologies Detector: Picometrics ZETALIF LED with 365nm LED |
Sample | Dextran 5000 labeled with 2AB |
Labeling | 2 mg of dextran 5000 are diluted in 15 µL of 2AB solution (30 mg of 2AB are diluted in 500 µL of methanol + 2.5% of sodium acetate + 2% boric acid) and 10 µL of sodium cyanoborohydride (238 µL in 262 µL of methanol + 2.5% of sodium acetate + 2% boric acid). This sample is heated at 80°C during one hour. After the reaction, the solution is diluted in distilled water to get a final volume of 250 µL. |
Method | A TSK gel NH2-100 150 X 2.0 mm, 3 µm, Tosoh Bioscience column with a flow rate of 0.2 mL/min was used. Phase A: water + 1.5% triethylamine + 1.5% acetic acid. Phase B: ACN + 1.5% acetic acid. |
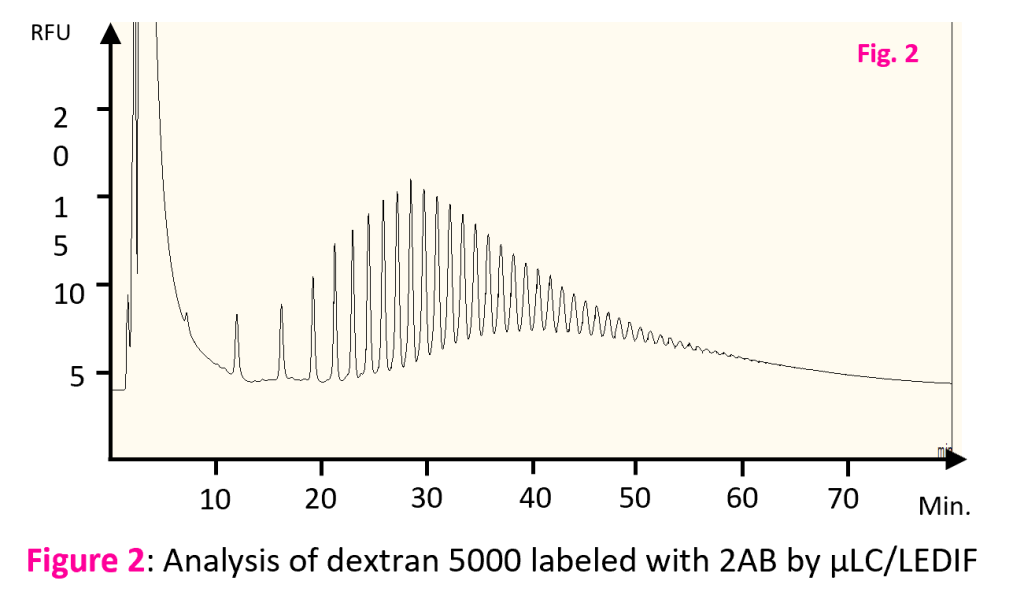
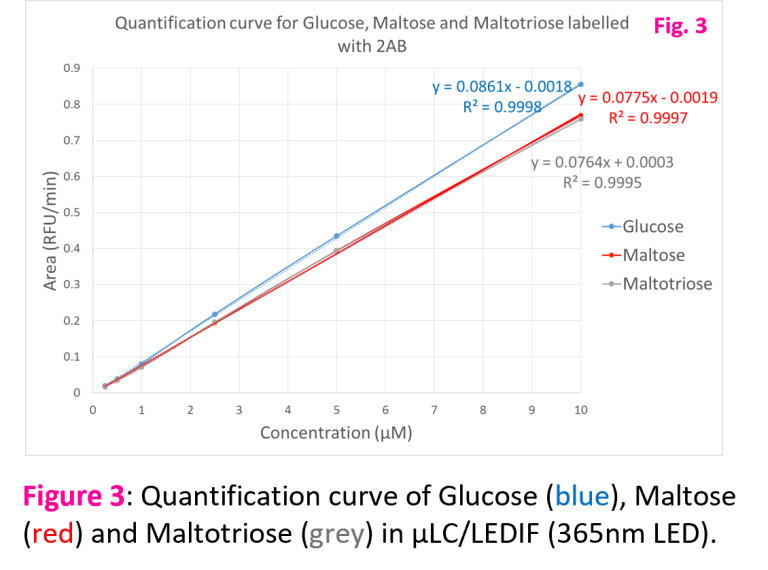
Figure 1 and 2 show respectively the separation of 3 sugars labeled with 2AB (glucose, maltose and maltotriose) and the separation of dextran by µLC/LEDIF. Figure 3 represents the quantification curve in the range 0.25 µM to 50 µM.
The quantification curve shows a linear correlation between concentration of sugars and fluorescence.
The limit of detection of glucose labeled with 2AB is 10 nM with a 365 nm LED.